Dynamic Attach
August 15, 2013 1 Comment
Continuing our discussion on Serviceability in Hotspot, we will look at Dynamic Attach in this post.
As the name implies, Attach API allows us to attach to the target Virtual Machine. By attaching to another VM, we can monitor what’s going on and potentially detect problems before they happen.
Attach API is a powerful mechanism introduced in J2SE 6 and above. Earlier versions of Java (J2SE 5 and below), if we got to hook the agent or enable gc logging, we got to stop the application, include the parameters in the startup script and then restart the application. From J2SE 6, inter-process modification of running JVM became practical.We can enable gc logging or hook an agent to another JVM at runtime. So, we don’t have to restart the application.
Most of the tools shipped with the JDK(jstack, jps, jinfo, jstat,..) rely on this Dynamic Attach API.
From JDK 6, we no longer required to start the application with any special option to be attached by JDK tools.
In this blog we will look at some of the code snippets which leverages Dynamic Attach API to get information dynamically from a running JVM.
In our typical java applications, we would use the standard java.* and javax.* libraries. Additional APIs are provided in tools.jar file. The Attach API classes are found in the com.sun.tools.attach and com.sun.tools.attach.spi packages.
The two main important classes used for attaching to the running VM Process:VirtualMachine and VirtualMachineDescriptor classes.
A VirtualMachine class represents a Java Virtual Machine. The VirtualMachine class is used to attach to an application. Once attached, we can use different methods (like listing all user’s virtual machines, loading an agent or library, etc) available with VirtualMachine class.
A VirtualMachineDescriptor is a container class used to describe a Java virtual machine. It encapsulates an identifier that identifies the target Virtual Machine. The identifier is implementation dependent, but it is typically the process identifier (pid) of the VM process in its Operating System.
jps – Java Virtual Machine Process Status Tool
The jps tool lists the instrumented HotSpot Java Virtual Machines (JVMs) on the target system. The tool is limited to reporting information on JVMs for which it has the access permissions. If jps is run without specifying a hostid, it will look for instrumented JVMs on the local host. If started with a hostid, it will look for JVMs on the indicated host, using the specified protocol and port.
The list of JVMs produced by the jps command may be limited by the permissions granted to the principal running the command. The command will only list the JVMs for which the principle has access rights as determined by operating system specific access control mechanisms.
The following code snippet provides the basic functionality of jps. It will list down all the java processes running on the local machine to which the user has access.
The static method VirtualMachine.list() returns a list with VirtualMachineDescriptor instances. A VirtualMachineDescriptor represents a JVM found on the machine it’s called on and contains the process id and a name of the JVM. The name is usually the command line which started the JVM.
import java.io.*;
import java.util.*;
import com.sun.tools.attach.*;
public class myJPS
{
public static void main(String[] args)
{
try
{
List<VirtualMachineDescriptor> vms = VirtualMachine.list();
for (VirtualMachineDescriptor vmd: vms)
{
System.out.println(“Process is “+vmd.displayName()+” Process id is “+vmd.id());
}
}catch(Exception e)
{
e.printStackTrace();
}
}
}
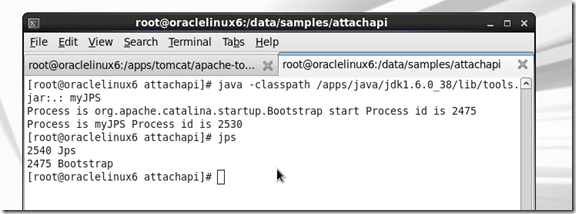
As shown in the image below, when we execute myJPS program, with the code mentioned above, we see the same processes as jps command which comes with the sun jdk.
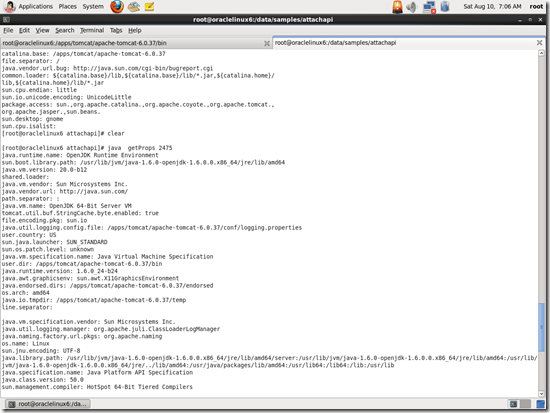
VirtualMachine provides read access to the system properties in the target VM. This can be useful in some environments where properties such as java.home, os.name, or os.arch are needed as part of troubleshooting.
The following piece of code helps us to get the System properties of running Java process.
VirtualMachine object is obtained by invoking the attach method with the process id(which is passed as an argument). After attaching to the VM, System Properties are obtained and then displayed.
if (args.length != 1) {
System.out.println(“Please provide process id”);
System.exit(-1);
}try
{
VirtualMachine vm = VirtualMachine.attach(args[0]);// get system properties in target VM
Properties props = vm.getSystemProperties();Enumeration em = props.keys();
while(em.hasMoreElements()){
String str = (String)em.nextElement();
System.out.println(str + “: ” + props.get(str));
}
}catch(Exception e)
{
e.printStackTrace();
}
We can attach to another process running Java code and launch a JVM TI agent or a java.lang.instrument agent in that process.
VirtualMachine instance is obtained by invoking the attach method.
After obtaining the Virtual machine, the loadAgent, loadAgentLibrary, and loadAgentPath methods are used to load agents into target virtual machine.
In the below example, we have taken the default agent available in JRE and attached that agent to the running process.
String agenturl=”/apps/java/jdk1.6.0_38/jre/lib/management-agent.jar”;
String JMX_CONNECTOR_ADDRESS=”com.sun.management.jmxremote.localConnectorAddress”;
if (args.length != 1) {
System.out.println(“Please provide process id”);
System.exit(-1);
}
try
{
VirtualMachine vm = VirtualMachine.attach(args[0]);
// get the connector address
String connectorAddress = vm.getAgentProperties().getProperty(JMX_CONNECTOR_ADDRESS);
System.out.println(“Connector Address, BEFORE –> “+connectorAddress);
vm.loadAgent(agenturl);
// get the connector address
connectorAddress = vm.getAgentProperties().getProperty(JMX_CONNECTOR_ADDRESS);
System.out.println(“Connector Address, AFTER –> “+connectorAddress);}catch(Exception e)
{
e.printStackTrace();
}
As shown in the below image, the Connector Address is null, before loading the Agent.
Connector address is displayed after loading the agent.
tools.jar
The library that contains the Attach API is tools.jar. This library is only available in JDK distributions, and is OS-dependent. Not having the right version of this file will probably cause an exception that mentions special operating system classes that are not for your machine.
The attach mode limitations
Unfortunately, the attach mode is not an ultimate solution.
- Existing JVMs provide only limited set of profiling capabilities for the attached agents.
- The attach mode is only supported for Sun Java (HotSpot) and JRockit.
- Attach may fail due to insufficient access rights.
Disabling Dynamic Attach
Attach API can be disabled on your JVM by setting -XX:+DisableAttachMechanism Java property.
When we set the options while starting the Tomcat ,
JAVA_OPTS=”-XX:+DisableAttachMechanism”
We see the Java process visible, but JConsole will be unable to attach to the running java process.
Based on the requirements, we can further extend these functionalities to process our requirements. Dynamic Attach provides the ability to list local JVMs, get some information about them and dynamically deploy agent based on Instrument API (Java) or JVMTI (native code). Local JVMs can be detected and manipulated without the need of any particular startup option.
Related Posts
https://zeroproductionincidents.wordpress.com/2013/07/20/serviceability-in-hotspot/
https://zeroproductionincidents.wordpress.com/2013/08/05/enabling-jmx-for-java-application/


Pingback: Enable GC Logging without restart | Zero Production Incidents